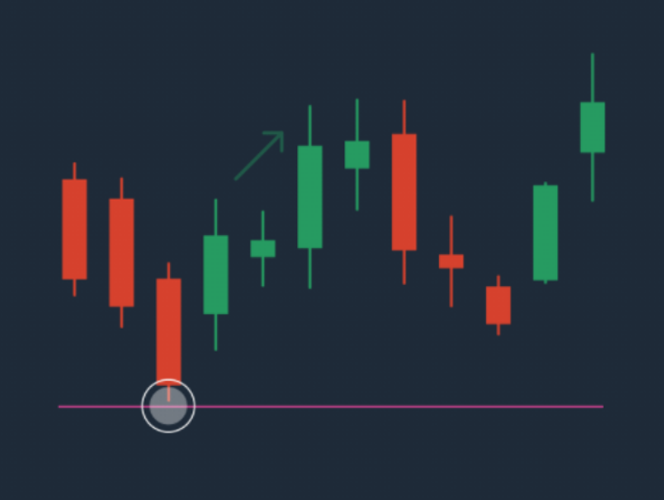
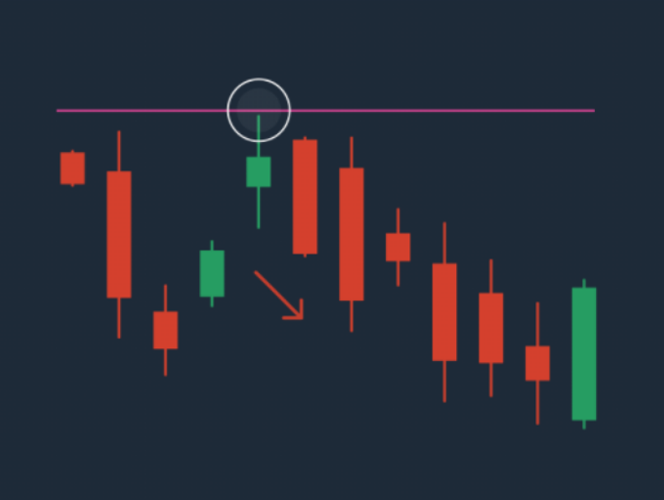
The horizontal line is a tool with which traders draw support and resistance levels on a chart.
The support level is the price level at which the asset value reverses and begins to grow.

The resistance level is the price level at which the asset value reverses and begins to fall.


