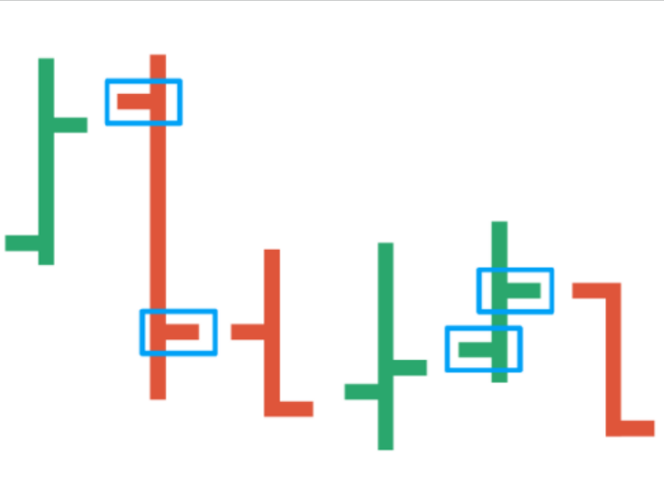
The horizontal line to the left shows the opening price, and the line to the right shows the closing price.

The central vertical line represents the maximum and minimum amounts reached by the price over a specified period (the time frame).


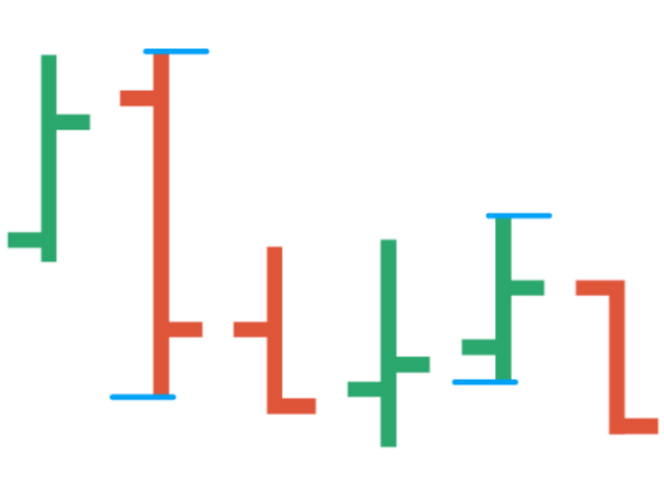
The horizontal line to the left shows the opening price, and the line to the right shows the closing price.

The central vertical line represents the maximum and minimum amounts reached by the price over a specified period (the time frame).


