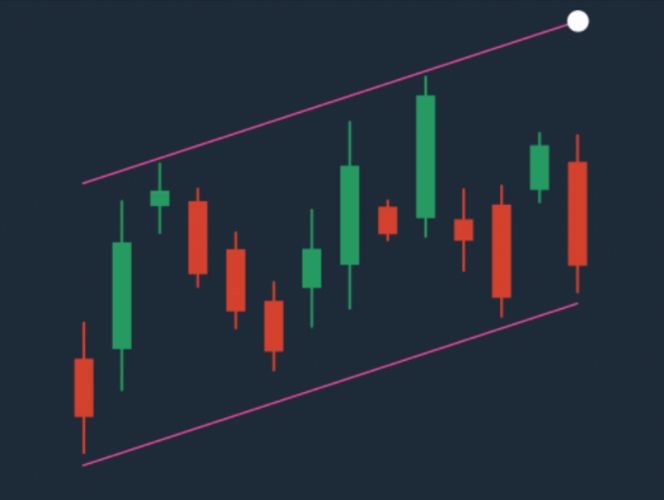
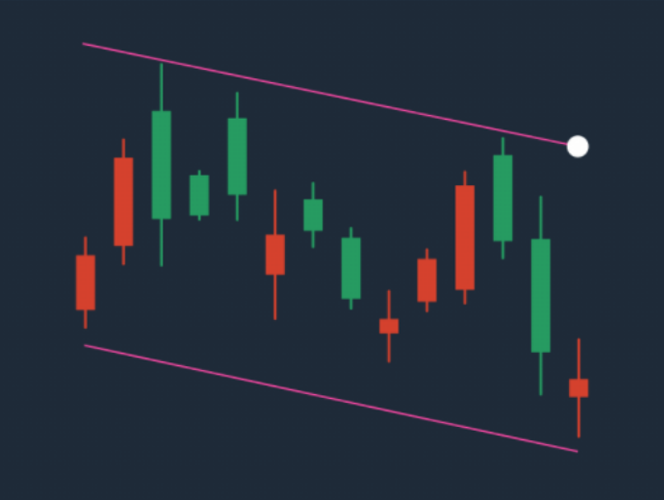
Look at the chart and determine the direction of the price movement.
Draw the support level first if a trend is ascending.
The support level is drawn on the lowest prices, that is, the lower shadows of the candlesticks.
Choose a few lowest prices and draw an upward line through them using the trend line tool.
Then draw the resistance level.

The resistance level is drawn on the highest prices, that is, the upper shadows of the candlesticks.
Choose a few highest prices and draw a line through them.


