The exponential moving average (EMA) is calculated using a special formula. EMA describes price behavior more accurately than SMA or WMA. You can keep the standard settings or change them to your liking.
You can also change the thickness and color of the line.
The main principle of trading using EMA is to trade in the direction of the trend.
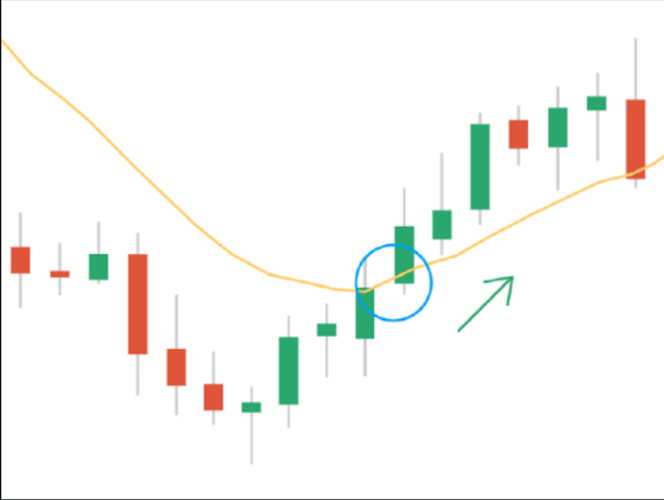
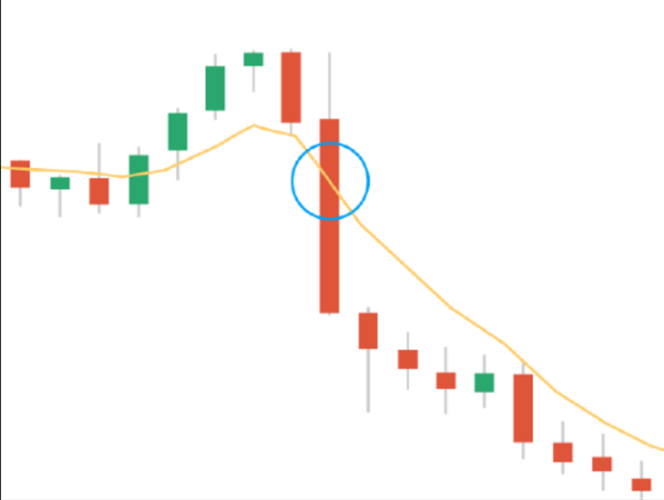
The best time to open a trade is when the asset price reverses. This is indicated by a change in the EMA line’s direction and it crossing the chart’s candlestick.
When the EMA line reverses and goes up and the chart’s candlestick crosses the indicator going upward, this is probably signaling an uptrend.

If the chart’s candlestick crosses the indicator going downwards and the EMA line reverses downward, this probably indicates a price reversal downward.


