• About Us
    • Company Profile
    • Regulatory Information
    • Why Choose Us
    • Promotions
  • Products
  • Platform
  • News
  • Service and Support
    • Common Business Issues
    • Risk Disclosure
    • Privacy Policy
    • Disclaimer of Warranty
  • Help Center
  • Contact Us
Menu
  • About Us
    • Company Profile
    • Regulatory Information
    • Why Choose Us
    • Promotions
  • Products
  • Platform
  • News
  • Service and Support
    • Common Business Issues
    • Risk Disclosure
    • Privacy Policy
    • Disclaimer of Warranty
  • Help Center
  • Contact Us
  • English
    • 简体中文
Login
  • English
    • 简体中文
Login
Open an Account
  • About Us
    • Company Profile
    • Regulatory Information
    • Why Choose Us
    • Promotions
  • Products
  • Platform
  • News
  • Service and Support
    • Common Business Issues
    • Risk Disclosure
    • Privacy Policy
    • Disclaimer of Warranty
  • Help Center
  • Contact Us
Menu
  • About Us
    • Company Profile
    • Regulatory Information
    • Why Choose Us
    • Promotions
  • Products
  • Platform
  • News
  • Service and Support
    • Common Business Issues
    • Risk Disclosure
    • Privacy Policy
    • Disclaimer of Warranty
  • Help Center
  • Contact Us
Login / Register
  • English
    • Chinese (Simplified)
  • About Us
    • Company Profile
    • Regulatory Information
    • Why Choose Us
    • Promotions
  • Products
  • Platform
  • News
  • Service and Support
    • Common Business Issues
    • Risk Disclosure
    • Privacy Policy
    • Disclaimer of Warranty
  • Help Center
  • Contact Us
Menu
  • About Us
    • Company Profile
    • Regulatory Information
    • Why Choose Us
    • Promotions
  • Products
  • Platform
  • News
  • Service and Support
    • Common Business Issues
    • Risk Disclosure
    • Privacy Policy
    • Disclaimer of Warranty
  • Help Center
  • Contact Us
Ticker Tape by TradingView

Red candlestick

December 5, 2021
  • Help Center
  • Chart
  • Japanese Candlesticks
  • Red candlestick

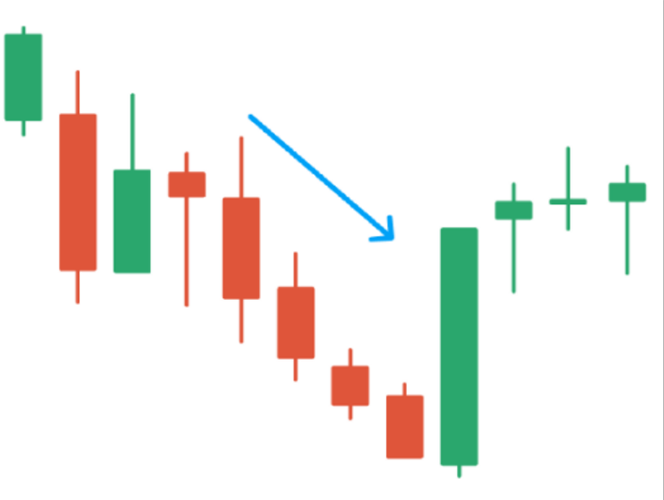
A red candlestick indicates that the price of an asset has fallen.

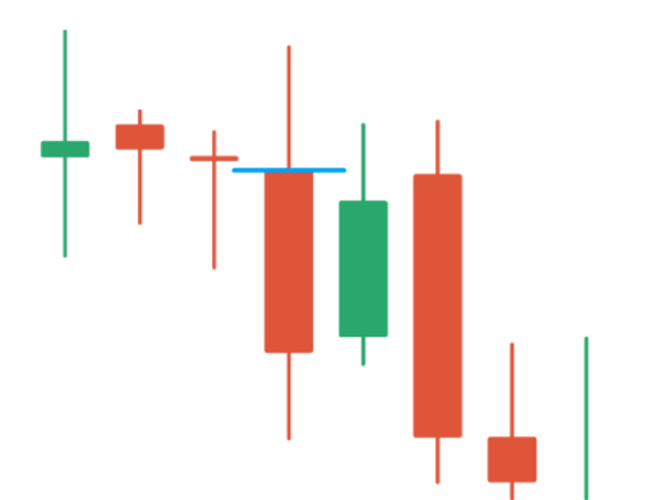
The upper boundary of the body is the price of the asset the moment the candlestick was opened.

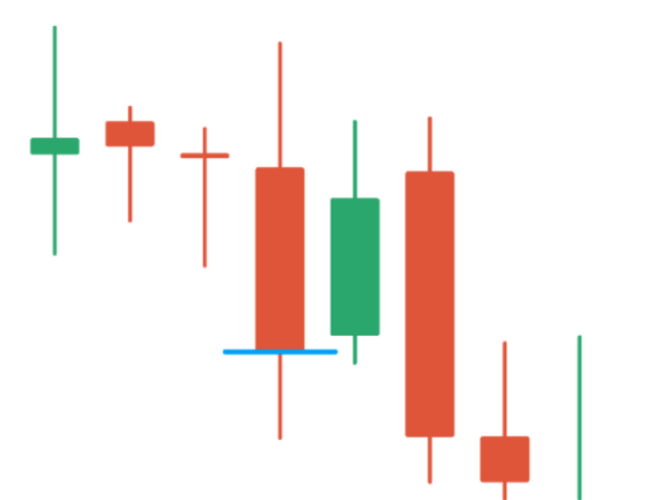
The lower boundary is the price of the asset the moment the candlestick was closed.

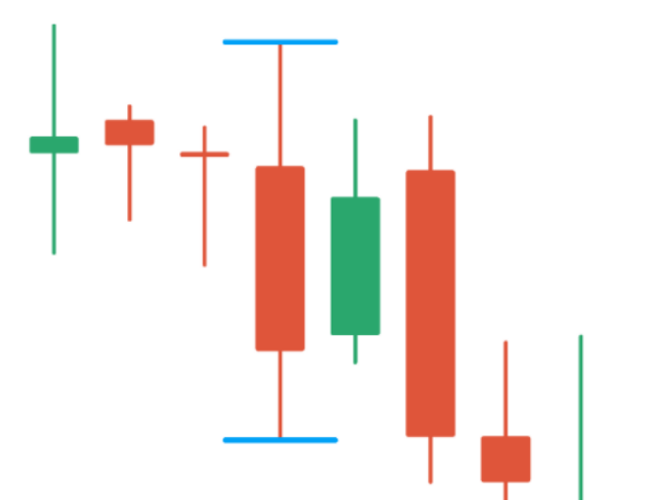
The shadow under the body of the candlestick shows the minimum amount reached by the price of the asset over a specified period of time. The shadow above the body shows the maximum amount.

Sometimes candlestick charts may be black and white. In black-and-white charts, the red candlestick will be shown as black.

Was this article helpful?
Like 1 Dislike 0

Next Step

Previous: Green candlestick
Next: Candlestick Time Frames
Share
0

The company is committed to meeting your global asset trading and investment needs

All transactions involve risks, and the loss may exceed your deposit.
Follow Us on

Getting started

Up to $100000 in virtual capital
Open a free demo account

Start real contract trading

Open a real account
Risk Warning : Trading CFDS on margin carries a high level of risk, and may not be suitable for all investors. Before deciding to trade foreign exchange, you should carefully consider your investment objectives, level of experience, and risk appetite. There is a possibility that you may sustain a loss of some or all of your investment and therefore you should not invest money that you cannot afford to lose. You should be aware of all the risks associated with foreign exchange trading, and seek advice from an independent financial advisor if you have any doubts.
Copyright © 2022 xxx. All Rights Reserved.
  • Privacy Policy
  • Risk disclosure
  • Disclaimer of Warranty