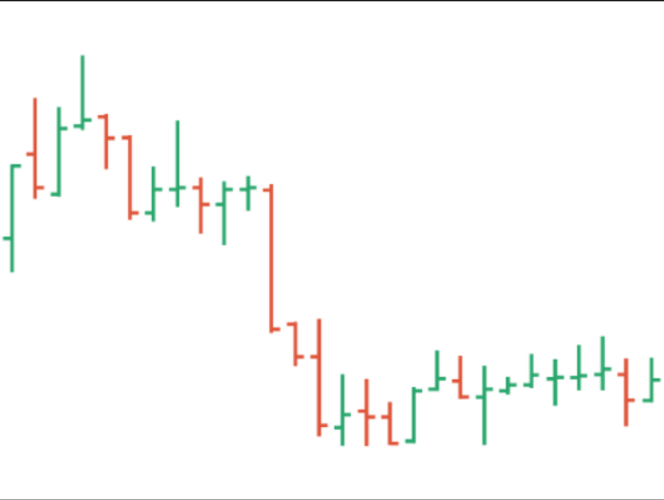
Bars are one way of representing changes in the price of an asset.
bars are similar to candlestick charts and contain the same information as Japanese candlesticks.
They differ only in appearance. Visually, bars are comprised of a vertical line and two smaller horizontal lines.


